These resources are the teaching and learning sequences developed through this research.
You can download and adapt these sequences. They include students’ work samples to help you anticipate student representational productions, and illustrate the learning.
If you try these resources, either as sequences or discrete activities, we would love to hear from you about your experience.
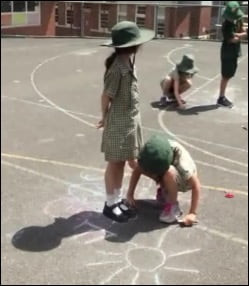
Students map their shadows across the day to track the path of the sun across the sky. They model the earth-sun system using a torch and shadows, earth globes and role plays, and develop an understanding about day/night and the earth’s rotation. The sequence focuses on spatial relations of the sun and earth, coordinating an earth centred and space centred perspective. The mathematics involves measurement, time, direction through on-going spatial mapping, data recording and analysis, and visual representation of data. Students develop understandings of the ways science and mathematics use modelling processes to understand natural systems and mathematical patterns.
Downloads
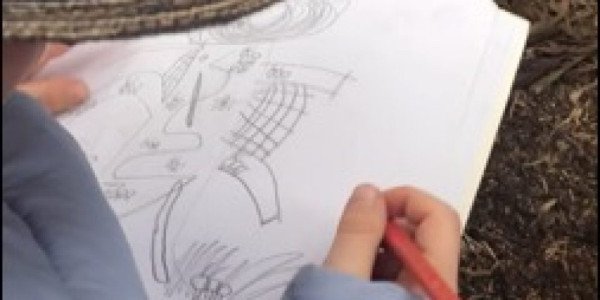
Students investigate their schoolyard environment. They record, organise, categorise, and represent their observations and communicate their ideas. Students generate recording and representing methods to investigate different schoolground habitats, including the diversity of living things, their interactions and needs. These include birds eye view and plot mapping, tallying of recordings, tabulation of data, bar graphing and diagrammatic drawings. They discuss the structure and function of invertebrates and their adaptation to schoolground habitats.
Downloads
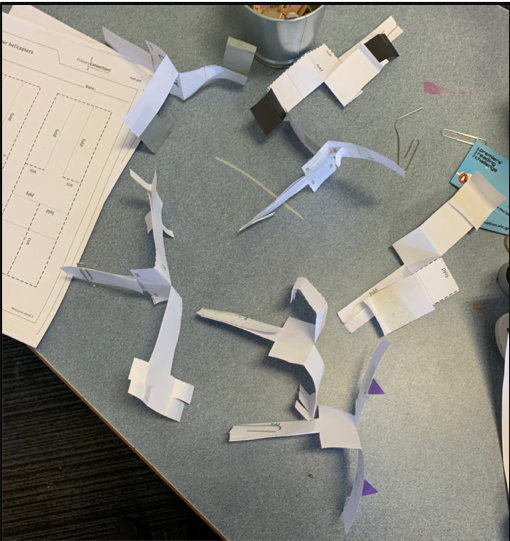
Students explore the flight of paper helicopters, the impact of weight and wing design. Students collect data about their helicopter design, test flights and the importance of generating formal measures to compare results. The data is analysed as class data with possible exploration of number lines, median, and/or mode measures.
Downloads
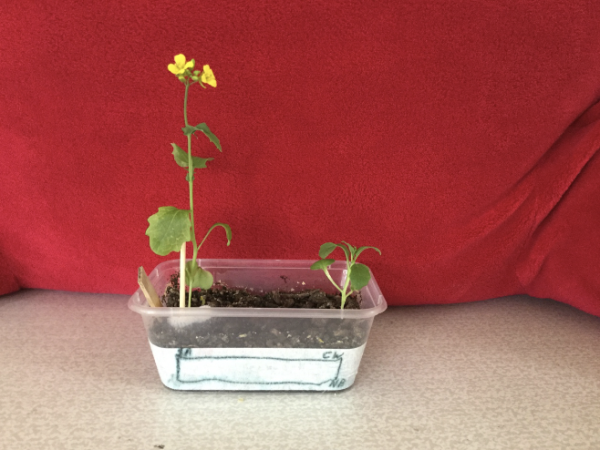
Students plant, observe and analyse the growth of their own flowering plant. They record, organise, categorise and represent their observations, and communicate their ideas. Students generate recording and representing methods to investigate and track the growth of their plant, including the variation in growth, pollination and seed production. These include diagrammatic drawings, tallying of recordings, tabulation of data and line graphing. They discuss the structure and function of flowering plants, and establish an understanding of the life cycle of a flowering plant.
Downloads

Heat and heat transfer, insulators and conductors are the focus of this teaching and learning sequence. Students design ways of keeping things warm and construct informal and then formal measures of temperature. They use tables to organise data during investigations, and devise ways of showing the data and representing change over time. This may include constructing line graphs, to demonstrate change in temperatures.
Downloads

How many students are tall enough to ride on theme park or water park rides requiring the minimum height of 1.4m?
Students investigate their height and that of their classmates. This learning sequence focuses on measurement of length/height in a familiar context and ways of representing data. Students estimate and order their heights using formal units (m/cm), develop understanding of variability, interpret ideas of range, mean, and mode and organise and represent data (categorical/cluster/frequency data). They apply concepts to new data sets.
Downloads
Students explore the path of light as it travels through different objects and from a source to our eyes. They construct and use a range of representations to describe observations, to show and model patterns or relationships between variables, to understand natural systems and mathematical concepts related to angle and reflection.